ANNUAL ECONOMIC INDICATORS
POPULATION
EMPLOYMENT
LARGEST EMPLOYERS
JOBS
BUSINESSES
UNEMPLOYMENT RATE
RETAIL SALES
FILM INDUSTRY
HOTEL ENVIRONMENT
HOTEL INVENTORY
POPULATION
Known for its exceptional quality of life, community-driven leadership, and top notch municipal services, Santa Clarita continues to attract new residents seeking a safe and beautiful place to call home. With 230,428 residents (as of January 1, 2025), the City of Santa Clarita is the third-largest City in Los Angeles County, following the City of Los Angeles (4 million residents) and the City of Long Beach (475,013 residents). The City of Glendale ranks as the fourth-largest City in Los Angeles County, with a total estimated population of nearly 206,283 residents.
Santa Clarita plays an important role in Los Angeles County based on its size. Here you will find some of the latest data available illustrating a growing, thriving, and attractive City and place to call home.
EMPLOYMENT
The City of Santa Clarita’s strong and diverse economy makes Santa Clarita the ideal destination for business. Maintenance of a highly supportive environment for business development is achieved through the cooperation of the Santa Clarita Valley Economic Development Corporation, the Santa Clarita Valley Chamber of Commerce, the Valley Industry Association, and the City government.
In addition, companies benefit greatly from the area’s modern business parks, as well as from a highly-skilled labor pool, variety of transportation choices, housing, quality of life, climate and scenery.
LARGEST EMPLOYERS
The Santa Clarita Valley’s top employers include Six Flags Magic Mountain, College of the Canyons, Princess Cruises, Henry Mayo Newhall Memorial Hospital, Boston Scientific, Quest Diagnostics, and the local school districts.
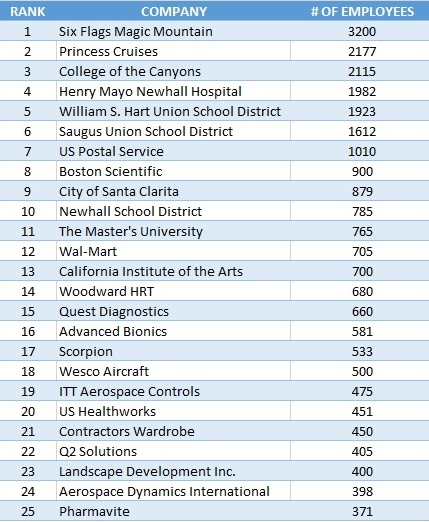
Source: California Economic Forecast and the Santa Clarita Valley Economic Development Corporation – 2019 Economic Outlook
JOBS
Employment numbers have experienced a record high with 92,437 jobs reported for the last quarter of 2018, compared to 76,334 in the last quarter of 2008. Over 20,000 jobs have been added since the fourth quarter of 2009 when the recession ended, an 29.3% increase.
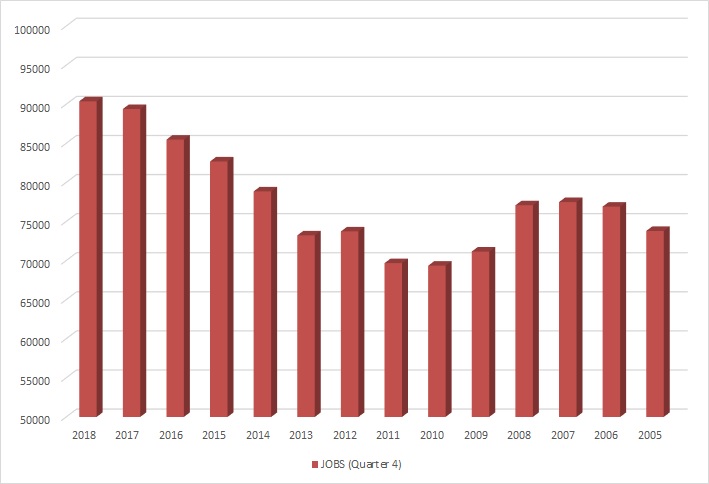
Source: California Employment Development Department – Labor Market Information Division
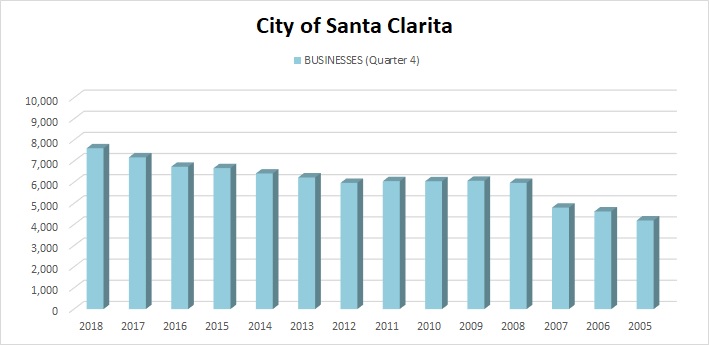
BUSINESSES
The City has experienced a steady rise in the number of business establishments over the last ten years with a high of 7,610 in the 4th quarter of 2018.
UNEMPLOYMENT RATE
Santa Clarita’s unemployment rate in December 2018 was 4% compared to 4.3% for the state of California. Here is a comparison of nearby cities, L.A. County and the state of California.
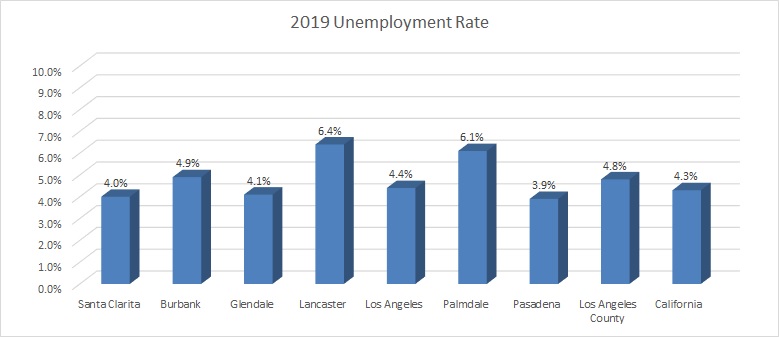
Source: California Employment Development Department, December 2018
RETAIL SALES
The California Retail Survey which compares retail sales activity for each of California’s 58 counties and 482 cities ranked the City of Santa Clarita 22nd in retail sales in the 2018 California Retail Survey. Santa Clarita is one of only 42 cities with a retail market above $2 billion and was again ranked higher in the survey than Beverly Hills, Burbank and Pasadena.
The following graph illustrates the trends in activity.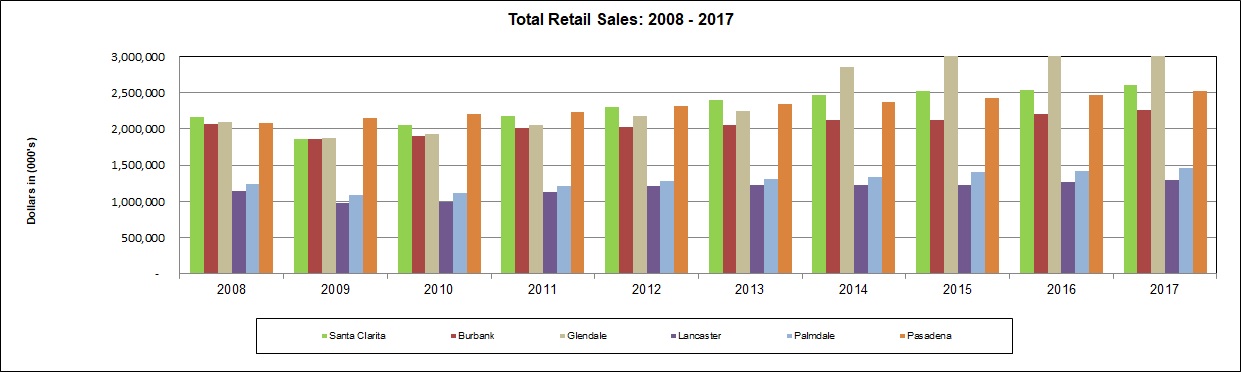
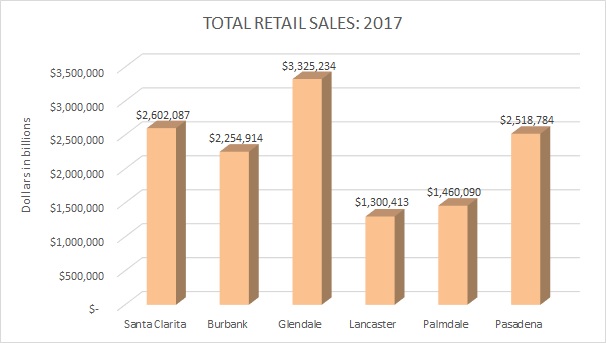
Source: California Retail Survey, 2018 Edition
Santa Clarita is on par with major shopping cities such as Glendale, home to Americana on Brand and the Glendale Galleria, as well as Pasadena, home to Paseo Colorado, Lake Avenue shopping District, and Old Town Pasadena, for both retail dollars and retail stores.
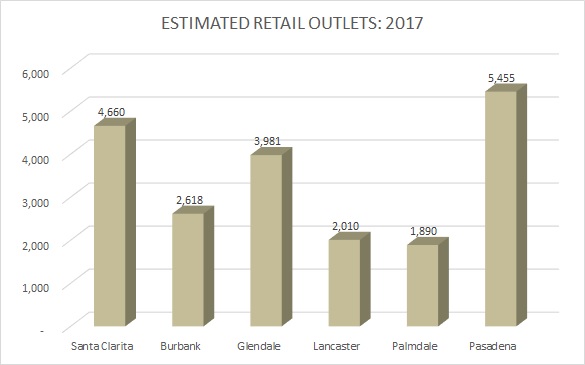
Source: California Retail Survey, 2018 Edition
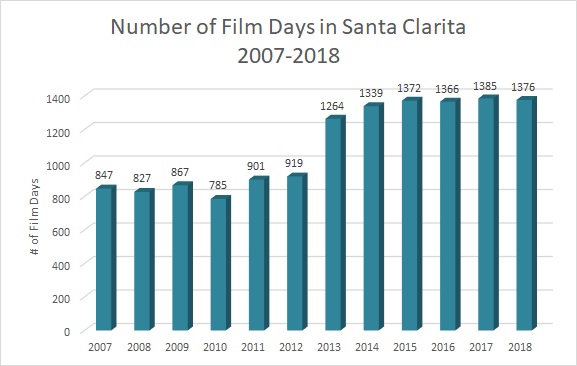
FILM INDUSTRY
The City’s Film Program celebrated another strong year, with a total of 1,376 film days in 2018 increasing by 2.8% from 1,339 in 2014.
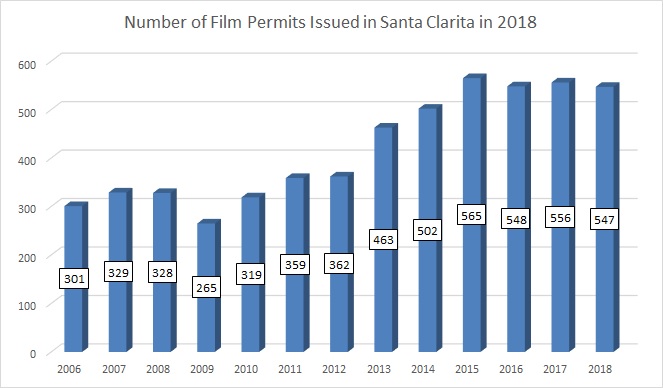
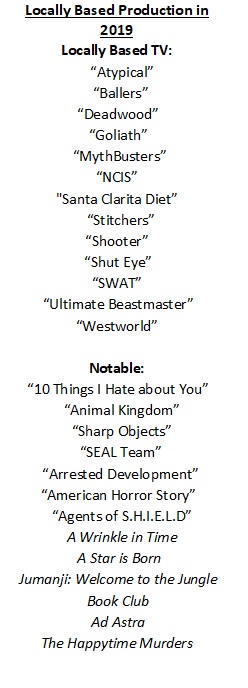
A strong film program means more business for local retailers and more jobs for the community. The City’s film-friendly permitting system, a responsive film staff, and the City’s innovative film incentive program resulted in $32.9 million in economic impact thanks to locally based productions and notable productions filming on location in Santa Clarita in 2018.
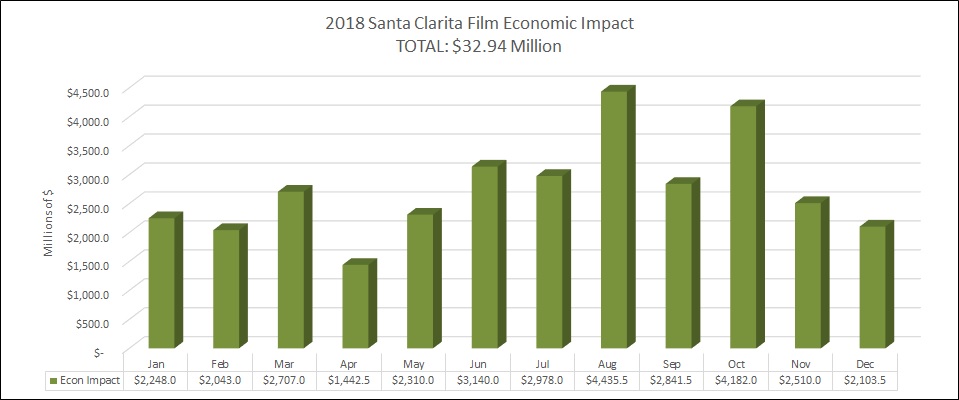
Source: City of Santa Clarita Film Office, 2019
Source: City of Santa Clarita Film Office, 2019
HOTEL ENVIRONMENT
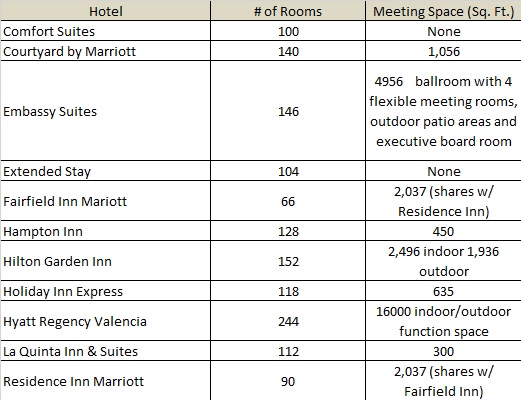
Santa Clarita’s hotel market remained strong throughout 2018. Average year-to-date occupancy percentage and average daily room rates for the year were 85% and $144.
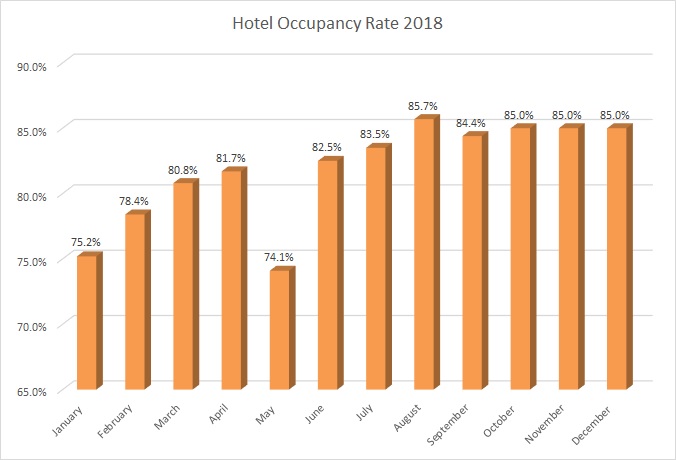
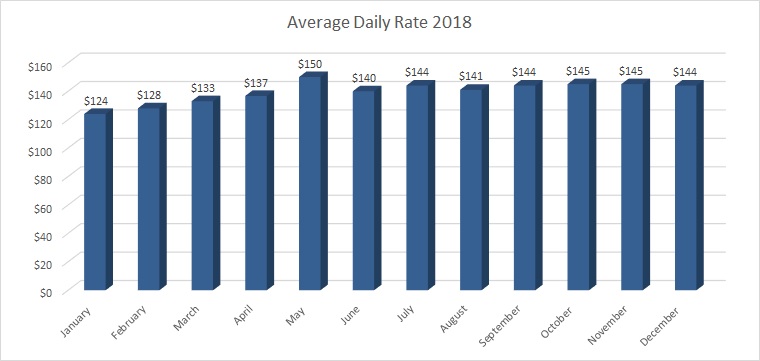
Source: STR
HOTEL INVENTORY
CRIME & HOUSING
CRIME
Santa Clarita consistently remains one of the safest cities in California as well as in the nation. Overall, Santa Clarita is the 4th safest among California cities with a population of at least 150,000 people and is the 13th safest in the United States.
The City of Santa Clarita unlike many other cities in Los Angeles County boasts a much larger share of owner-occupied housing units compared to housing units occupied by renters. Close to three-fourths or 73% of Santa Clarita’s housing units are owner-occupied compared to only 39% countywide.
Santa Clarita’s housing stock is substantially newer than that of the entire County. One-third or 33% of Santa Clarita’s housing stock was built from 1980 through 1989. In comparison, only 12% of Los Angeles County’s housing was built during this same time period. Additionally, only 5% of Santa Clarita’s housing was built prior to 1960; whereas, 48% of the County’s housing was built prior to 1960.
Santa Clarita’s average housing vacancy rate for 2005 ¨C 2009 was 3.85% compared to 5.7% for the County of Los Angeles.
Single-family homes in the entire Santa Clarita Valley have increased in value each year from 2000 to 2006. Median resale prices in 2010 dropped less than 1% to $406,408 from 2009 and were 33% below the peak in 2006.
Condominium resale prices followed a similar pattern in the Santa Clarita Valley. In 2010, the condominium resale price was $227,700 or less than 1% above prices in 2009. The 2010 median resale price was 40% below the median price in 2006.
Median home prices in the City of Santa Clarita remain affordable compared to other cities in Los Angeles County. The March 2011 median home price of $330,000 was slightly above that of Los Angeles County at $318,000. In fact, Santa Clarita’s home prices are substantially lower than those found in Glendale, Burbank, and Pasadena and somewhat higher than those found in Los Angeles..
MONTHLY ECONOMIC SNAPSHOT
Visit the Santa Clarita Valley Economic Development Corporation to see the monthly economic snapshot. These indicators provide a general snapshot of the overall financial health of the community. Indicators that are monitored include the real estate market, commercial and residential development, tax generation, and film and visitor activity.
For the most current information please visit their website below:
POPULATION
POPULATION
INCOME
EDUCATION
AGE
ETHNICITY
POPULATION
With 213,231 residents, the City of Santa Clarita is the third-largest City in Los Angeles County, following the City of Los Angeles (3.9 million residents) and the City of Long Beach (472,779 residents). The City of Glendale ranks as the fourth-largest City in Los Angeles County, with a total estimated population of nearly 199,182 residents. Santa Clarita is the 18th largest city in the State of California following San Bernardino’s 213,933 residents. Consequently, Santa Clarita plays an important role in the County based on its size.
Over the past ten years, Santa Clarita’s population size has continued to steadily increase. During this time period, the population growth was the result of new housing construction in the City as well as annexations of surrounding areas into the city limits. Since 2007, the population of Santa Clarita and other comparison cities appears to have slowed down compared to the first part of the decade.
In fact, Santa Clarita’s population grew by 17.5% from 2000 to 2010 and was almost twice the growth experience in all of Los Angeles County. Only the communities of Lancaster and Palmdale in the Antelope Valley grew faster than Santa Clarita.
Source: California Department of Finance, July 2007
By the year 2015, the population of the City of Santa Clarita is forecasted to exceed 193,000. Growth is forecasted to continue over the coming decades to 239,900 by the year 2035.
| Source | Amount |
| 2005-2009 American Community Survey, US Bureau of the Census | $82,602 |
| 2010 Estimates from Southern California Association of Governments | $87,927 |
Santa Clarita’s population is well-educated with 65% of adults at least 25 years of age having some college or higher. People in the City are more educated when compared to the Los Angeles County average in which only 54% have attained some college or higher. This indicates a greater likelihood for professionals and technical employees residing in the City.
Located either in or near the City of Santa Clarita are four well-known colleges whose total enrollment exceeds 60,000 students. In Santa Clarita are College of the Canyons, the fastest growing community college within California, along with California Institute of the Arts and The Master’s College which are both renowned in their areas of specialty. Located near Santa Clarita is California State University, Northridge.
| NAME OF COLLEGE | ENROLLMENT |
| California Institute of the Arts | 1,467 |
| The Master’s College | 1,417 |
| College of the Canyons | 22,334 |
| California State University, Northridge | 35,272 |
| Total | 60,490 |
Source: Individual school web sites, June 2011
Another important indicator of the quality of life in Santa Clarita is test scores or Academic Performance Index (API) averages for each of the school districts serving Santa Clarita. Performance increased among every school district in 2010 compared to 2009. The district with the highest API is Newhall School District with an API in 2010 of 896. The API for the William S. Hart Union High School District which encompasses junior and senior high schools rose to 824 in 2010 from 816 in the previous school year.
Each of the Santa Clarita based school districts attained higher APIs in 2010 than the Los Angeles Unified School District, and all had higher or comparable APIs to other districts of cities nearby.
In the Santa Clarita area, 38 schools comprise the elementary school districts and 19 junior high and high schools are part of the William S. Hart Union High School District. The majority of these schools are either California Distinguished Schools and/or National Blue Ribbon Schools. This further demonstrates the superior quality of education available to families with children under the age of 18 in Santa Clarita.
|
SANTA CLARITA AREA SCHOOL DISTRICT |
# OF SCHOOLS |
| Newhall Elementary | 10 |
| Saugus Union Elementary | 15 |
| Sulphur Springs Union Elementary | 9 |
| Castaic Union | 4 |
| William S. Hart Union High | 19 |
Sources: California Department of Education, U. S. Department of Education, 2011
AGE
Santa Clarita’s population is relatively young in age with 28% of the population under the age of 18. Approximately 30% are between the ages of 25 and 44 and 24% are school age between the ages of 5 and 19.
In general, the City’s population is not as diverse as the County’s population. More than three-fourths or 76% of Santa Clarita’s population describes itself as White.
More than one-fourth or 28% of Santa Clarita’s population is Hispanic compared to 47% of Los Angeles County and 36% of California’s population.
Santa Clarita’s Asian population is quite diverse. In fact, 36% of the City’s Asian population is Filipino followed by 16% who are Korean. An additional 16% are Asian Indian, 11% are Chinese, and 10% are Japanese.